How to Set a Baseline in Microsoft Project
As a project manager, it is important to know how the project is tracking compared to the original plan. The baseline allows you to take a snapshot of the original plan which can then be compared to the actual progress.
As plans frequently change, you can save up to 11 baselines. However, if you notice it changing too many times, it could be sign of scope creep or schedule issues.
Follow these simple steps:
Go to the Project tab
In the ribbon, under the Schedule section > Click Set Baseline > Select Set Baseline
In the pop-up window, keep ‘Set baseline’ selected and then use the dropdown list to select a baseline to save. NOTE – When you select from Baseline 1 to Baseline 10, the date will be indicated next to the baseline.
Under ‘For’ ensure that ‘Entire Project’ is selected.
Click > Okay
To view your actual progress to the baseline, you need to ensure the baseline is selected.
To do this, go to Gantt Chart Format > under the Bar Styles ribbon click Baselines and then select the Baseline to track against.
Ensure that you are in the Tracking Gantt view. Go the View Tab, select Gantt Chart and click on Tracking Gantt.
STEPB BY STEP GUIDE
1. Click on the Project tab (Figure 1)
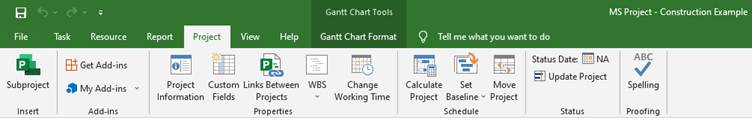
Figure 1: Project tab and the associated ribbon
2. Click on Set Baseline under the Schedule ribbon and select Set Baseline… (Figure 2)
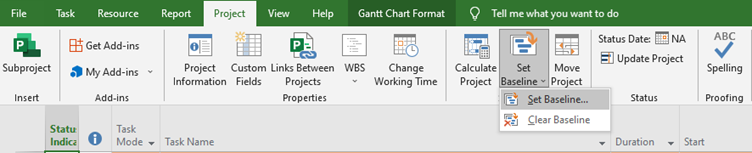
Figure 2: Selecting the ‘Set Baseline’ command under the Schedule section of the ribbon
3. Under Set baseline, select a Baseline between Baseline and Baseline 10. (Figure 3 and 4)
4. Under For: select Entire Project.
5. Click on OK.
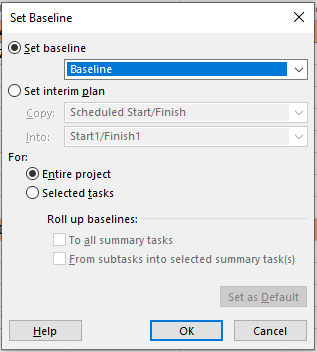
Figure 3: The command pop-up for setting the baseline
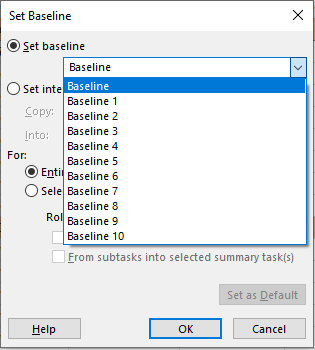
Figure 4: Eleven baselines can be set
NOTE – A saved Baseline will show the date that a baseline was saved when using Baselines 1 to 10, see Figure 5.
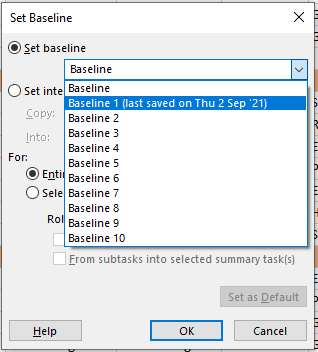
Figure 5: Baseline 1 was saved and now shows the date it was saved
6. To set the baseline, go to the Gantt Chart Format tab and under Bar Styles click on Baseline
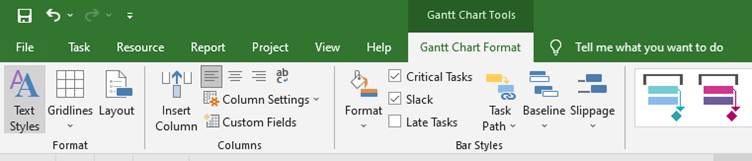
Figure 6: Gantt Chart Format Tab
7. Select the saved baseline that you would like to track against. In Figure 7, baseline 2 has been selected.
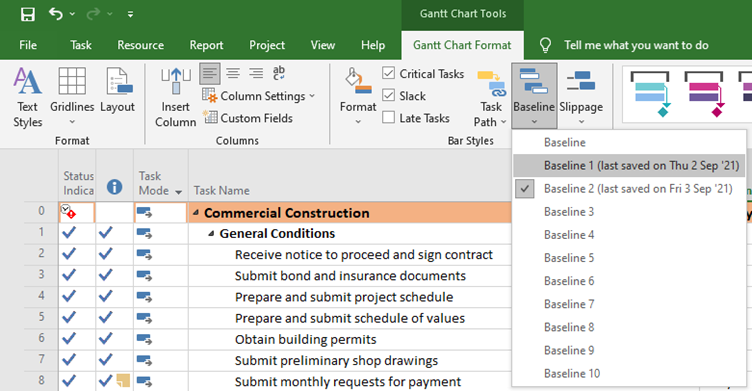
Figure 7: Selecting the Baseline Command in the Baseline Styles Ribbon
To view the baseline against the actual schedule, make sure you are using the Tracking Gantt view.
8. Click on the View tab, select Gantt Chart and select Tracking Gantt, (Figure 8).
You should now see the Gantt bars for the baseline against the actuals.
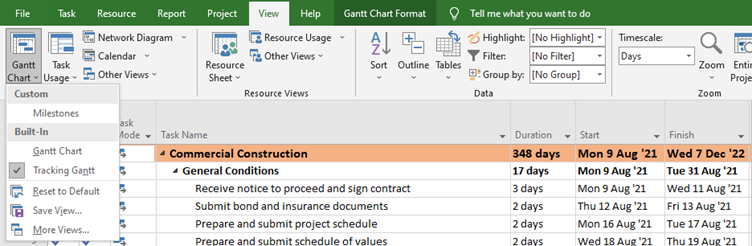
Figure 8: Selecting the Tracking Gantt View
In the screenshots below, Figure 9 shows the Tacking Gantt with Baseline selected. In Figure 10 the baseline has been set and in Figure 11 I have made changes to the durations which clearly show how the actuals have changed compared to the baseline.
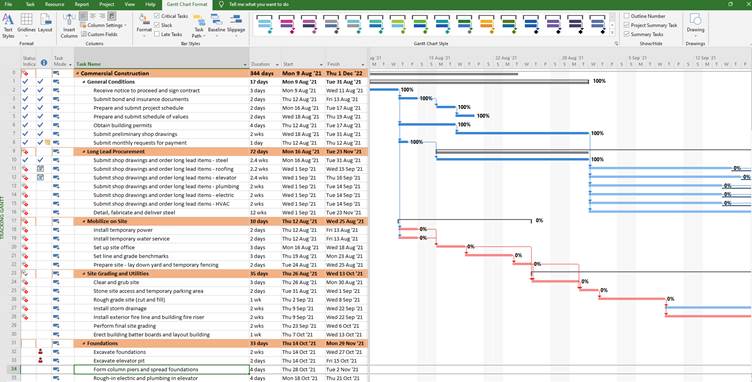
Figure 9: Tracking Gantt Chart with No Baseline
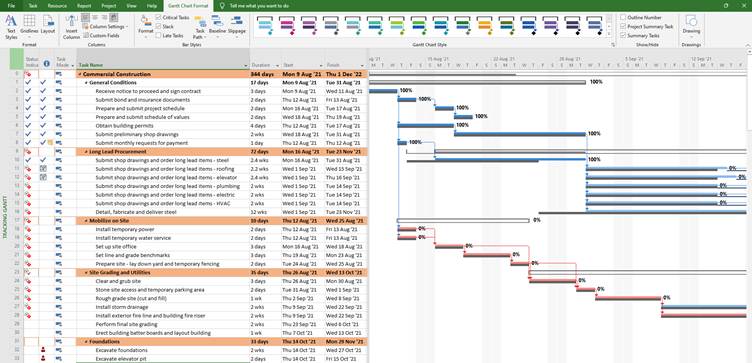
Figure 10: Tracking Gantt Chart with a Baseline Set
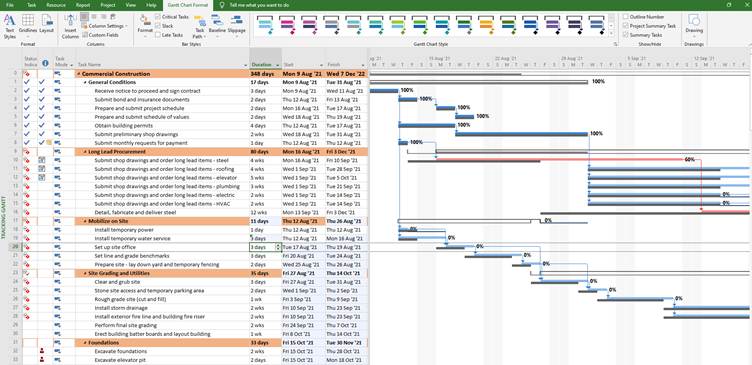
Figure 11: Changes to the Schedule Reflecting Differences between the Baseline